Thursday, December 08, 2011

Managing Exchange Folders and Item Counts

So in my last blog entry I talked about the PAL tool and how it can help you get a handle on your servers performance.  Today I’d like to discuss PFDAVAdmin.  This is a tool free tool that you run on your Exchange server (2000 or 2003) to get a look inside of all your mailboxes and folders to get things like the total number of items in a folder inside a mailbox.  Here are the details to do just this. 

  1. Download the tool
  2. Install the tool on the Exchange server
  3. Connect to the server, global catalog server and select All Mailboxes
  4. On the Tools menu select Export Properties
  5. On this window put in a destination for the location you want the output file to be dropped (it will be in tab delimited format)
  6. Select these three check boxes:
    1. PR_CONTENT_COUNT
    2. PR_DISPLAY_NAME
    3. PR_FOLDER_PATHNAME
  7. Hit Ok
  8. Grab much needed caffeine while you wait.
  9. The server will begin processing you you will get an output tab delimited file that you can load into excel and pretty up showing the users ID, folder name and number of items in the folder for each mailbox on the server.

This helped us identify those “offenders” that never delete or move anything. After we identified and cleaned up some of our users our exchange 623 and 1022 errors started getting less and less frequent.  The latest Microsoft support person (who speaks English as a first language….note it takes 4 weeks to get one btw) says that we still have a large number of items in our “search folders” that we need to deal with.  I can see the search folders in the tab delimited file but there are multiple ones to deal with. Some are Blackberry search folders, some are Cisco Unity Search folders, some are Finder search folders and others are something called MS-OLK-BGPooledSearchFolder search folders.   We were told Blackberry search folders could be  cleaned with the MFCMapi tool.  There’s also a reg fix which I believe is for the MS-OLK-BGPooledSearchFolder folders.  I haven’t run these fixes yet but I’ll let you know how it turns out.

These issues have reinforced something I’ve been saying for years. There are two evils in IT….printers and email.  You’ll never completely rid yourselves of issues with either one.
Friday, December 02, 2011

PAL – Performance Analysis of Logs

Wow…been a long time for an update eh?! Well most of this year I’ve been working on our Windows 7/Office 2010 rollout.  Also been working on a massive shift from one archive solution to another…but that’s another whole story…

After we upgraded one of our sites from Outlook 2003 to Outlook 2010 we coincidentally had huge issues with Exchange 2003.  We started getting 623 errors in event logs followed by 1022 errors which ended up raping, pillaging and plundering our Exchange information stores. So after weeks of the Microsoft Advanced Diagnostics team, which seems to be based out of somewhere in India, said our issues were caused by too many mailboxes with message counts greater than 5000 in folders. No shit..really?!  Still working on this issue so I’ll let you know how it turns out.

So back to PAL. During my research into Exchange performance I found the PAL tool at codeplex.comPAL is a tool that will look at your perfmon counter logs and tell you what’s up with your server.  Unlike, the Baseline Analyzer tools, it reacts to running conditions on your servers and lets you know what seems to be running “out of bounds”.  Turns out a bunch of subject matter experts at Microsoft got together and set some rules in the PAL tool to alarm/alert just like a traditional expert system would. Very cool stuff.
image

So here’s the quick and dirty on getting started with PAL:
  1. Download PAL from here
  2. Install PAL
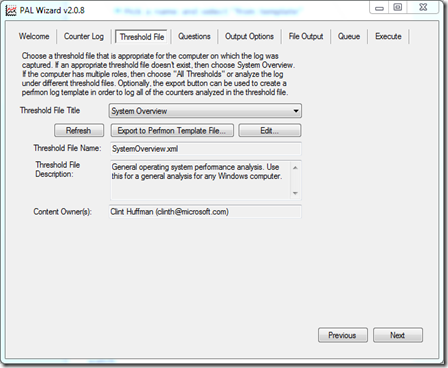
  3. Run PAL and go to the Threshold File Tab
  4. Pick the type of analysis you want to run…Start with System Overview…it will get you started (Threshold File Title)
  5. Now click on “Export to Perfmon Template File”
  6. Now if it’s a 2003/XP system save the filetype as .htm, if it’s 2008/Win7 save the filetype as .xml.
  7. Copy the template to the system to be monitored
  8. Run perfmon
  9. (Note: The rest of this is steps for 2008/Win7..if you are on 2003/xp figure it out for yourself. ;P)
  10. Go to Data Collector Set
  11. Right click on “User Defined”
  12. New Collector Set
  13. Pick a name and select “from template”
  14. Browse for the template
  15. Hit Finish
  16. Right click on the collector and start it
  17. Run it for awhile and stop it
  18. Take the results file back to your PAL workstation and start from the first tab.
  19. On counter tab, select the resultant file
  20. On Threshold file Tab reselect the one you started with
  21. On Questions Tab, answer the 4 questions about the system you were monitoring
  22. Output Options Tab, leave it at auto for now
  23. File Output Tab, leave defaults
  24. Queue Tab, leave defaults
  25. Execute Tab, select Execute and hit finish
  26. Wait…it takes awhile to process
  27. Enjoy your html output file and analysis of what was up with your server
One last thing to note…scroll through your Threshold File Titles…there’s a lot to choose from.  You can run some very specific tests.  These all relate to specific counters to “watch” in perfmon so it’s a great learning tool just looking at what’s important to watch.
Enjoy.
image