Wednesday, April 29, 2009

OSSEC rocks my socks

OSSEC is a security tool which can be best classified as a host intrusion detection system.  It can be installed in three modes: local, agent or server.  I installed it as a local install on my test box so that I could see how it worked. What a cool app! image  It installs in seconds and when enabled, sits in the background watching your log files, changes made to executable files and a bunch of other stuff.  If it sees any funny business it drops you an email to let you know. It can even be configured to automatically add IPTables firewall rules when it detects people running attacks against your server.  The default settings detected things like incorrect password attempts, initial logins by users and the creation of new users and groups.   It even detects things like the existence of root kits on Linux.   Most of it runs from the command line but there is a web gui as well.

I’ve been hitting the research hard looking for log analysis tools for apache and linux and this tool is going to be very useful.  This may even remove the need for my centralized syslog box as it parses out the good info from the bad.  We will see…. I haven’t dropped this on my production web server yet, but I will soon.

Two thumbs up for this useful tool…

Oh yeah…there is a agent for Windoze boxes as well. ;)

Tuesday, April 28, 2009

Show all users cron jobs

Just a quick one today…it’s been a busy busy few days. :)  Here’s a quick way (when logged in as root) to see all the cron jobs configured on a system:

for user in $(cut -f1 -d: /etc/passwd); do crontab -u $user -l; done

Watch the line wrap and enjoy!

Tuesday, April 21, 2009

Housecleaning Linux Style

It’s been quite a busy few days here at the Firm. We’ve gone live with a new website (hosted on Linux of course), exchanged a ton of electronic files with one of our vendors ala TrueCrypt and finished off our monthly reboots (thanks Microsoft).  So the web server was probably the most fun.  During the process I enabled Google Analytics, awstats, logwatch, selinux and iptables. Google Analytics is great for getting the quick on dirty stats for your web server.  This is the first time I’ve enabled it site wide and it has really been eye opening.  Do yourself a favor and use it on your site to track where people are going.  I even enabled it on my blog and it seems my posts on Equallogic and HP Procurve are my top hits.

Awstats is a perl script the parses your Apache access_log and reports back on your web site statistics in a meaningful way.  (It can do other apps like ftp as well, but I’m only using it for httpd.) Lots of great info here but it takes a bit more tuning to get running they way you want it. I’m still tweaking the output but I hope to get it all done soon.

Logwatch is a tool built in to most distros that parses your log files and rolls up some really basic, but important statistics which it then optionally emails to you.  You are probably running this tool already and don’t even know it.  Do yourself a favor and edit your logwatch.conf file (mine is under /usr/share/logwatch/default.conf) and add your email address to the “MailTo =” line.  As this is a web server I’m interested in who is logging in remotely  and logwatch details out SSHD login info :

sshd:
   Authentication Failures:
      root (192.168.31.111): 216 Time(s)
      unknown (192.168.51.11): 48 Time(s)
   Invalid Users:
      Unknown Account: 48 Time(s)
   Sessions Opened:
      root: 27 Time(s)

Failed logins from:
    xx.xxxx.xx.xxx: 216 times
       root/password: 216 times

Illegal users from:
    xx.xxx.xx.xxx: 48 times
       oracle/password: 48 times

Users logging in through sshd:
    root:
       xx.xxx.xx.xx(aserver.ontthenet.com): 21 times
       xx.xx.xx.xxx(anotherserver.onthenet.com): 3 times
       xx.xx.xx.xx(ahost.outtheresomewhere.com): 2 times
       xx.xx.xxx.xxx(anotherhost.outtheresomewhere.com): 1 time

Received disconnect:
    11: Bye Bye
       xx.xxx.xx.xxx : 264 Time(s)

SFTP subsystem requests: 21 Time(s)

Logwatch will summarize much more then just the sshd logs, but I wanted to give you a sample of it’s power. 

SELinux is of course an application layer firewall. It will keep services/daemons contained in their own “space” so that they all get along.  Should something get hacked, SELinux will keep the hacker from accessing data beyond what the compromised service has rights to. It’s a little hard to get your arms around, but it’s well worth the time invested learning how it works.

iptables is a very flexible and useful firewall.  One thing that I learned how to do was to restrict the number of login attempts so that hackers will be blacklisted by IP address if they try and run something like rainbow tables against your sever.  Here’s the quick and dirty :

iptables -A INPUT -i eth0 -p tcp --dport 22 -m state --state NEW -m
recent --set --name SSH

iptables -A INPUT -i eth0 -p tcp --dport 22 -m state --state NEW -m
recent --update --seconds 60 --hitcount 8 --rttl --name SSH -j DROP

This lines are wrapped here, but you can use that as a head start.  Lots and lots of buttons and knobs to turn that’s for sure.

Enjoy.

Tuesday, April 14, 2009

NTOP on CentOS 5.3 for Netflow Monitoring

I did an NTOP install on CentOS 5.3 today and it was a little different then I’ve done before. image The SecurityTeam.US repository doesn’t seem to contain ntop anymore so I had to switch repositories. I did the following:

  • Install a repository that has the ntop package available: “rpm –Uhv http://apt.sw.be/redhat/el5/en/i386/rpmforge/RPMS/rpmforge-release-0.3.6-1.el5.rf.i386.rpm
  • Install ntop “yum install ntop”
  • Run ntop “ntop”
  • When asked, you’ll need to supply a password for the default admin account.  It get’s a little lost in the start up noise but if you scroll back you should see the request.
  • run “service ntop start”
  • run “chkconfig ntop on”
  • Now it should be up and running and should restart at the next reboot as well.
  • Allow ports 3000/tcp and 2055/udp if you have firewalling enabled.  Port 3000 is for ntop and port 2055/ubp is for netflow.
  • From another PC web browse http://yourserverip:3000
  • Now, enable Netflow: From the menus select Plugins, Netflow, Enable
  • Now make sure you are monitoring on the correct interface. Admin, Switch NIC. For me the interface was NetFlow-device.2 [id=1]. 
  • Now set your Netflow defaults.  Plugins, Netflow, View/Configure.
    • Select the device you want, Hit the Edit Netflow Device button.
    • I left the name alone as NetFlow-device.2
    • Change local collector udp port to 2055 (the default port).
    • Hit the Set Port button
    • Virtual Netflow Interface is the interface on the router (indicated as the flowexport source interface below) that will be sending you the netflow stream of data.  Also put it’s mask. (For me this was 192.168.1.1/255.255.255.0)
    • Hit the Set Interface Address button
    • Aggregation – none (This was my preference)
    • Hit the Set Aggregation Button
    • The only other thing I changed was debug. I turned it off.
    • Hit the Set Debug button

So the next step was to configure our router to point to the ntop box.

  • Login to privileged mode on the router
  • (config)#ip flowexport source <interface number>
  • (config)#ip flowexport version 5 peeras
  • (config)#ip flowexport destination<ip address> <port number>
  • (config)#ip flowcache timeout active 1
  • Not change to the interface you want to monitor
  • (config-if)# interface <interface>
  • (config-if)# ip routecache flow
  • (config-if)# bandwidth 1544
  • (config-if)# wr

In the above example I used a few abbreviations: <interface number> is the local interface you want to use to send the data from (faste 0/0 for me).  It’s NOT the one you want to monitor.  <ip address> and <port number> are the ip address and the port that ntop will be listening on.  The default port is 2055 udp.  The bandwith of 1544 which is the speed of a T1 line.  You’ll have to adjust that for your line speed.

Ok pop back to the web interface and look at the Netflow Statistics.  (Plugins, Netflow, Statistics).  You should eventually see the Packets Received number start to grow. If it’s growing you’re getting data.  Now you should be able to browse through the menus and start to look at your data. It takes awhile for the data to build and be meaningful but it’s pretty cool.

Drop me a comment if you are interested and I’ll run through what some of the data means.

Monday, April 06, 2009

Portable Ubuntu for Windows

One of my beefs with VmWare on my main workstation is that it adds virtual networks and some services which slow and bloat the system even if I don't have a VM up and running.  Over the weekend I ran into a cool little...well I guess it's a distro...called Portable Ubuntu for Windows.   image  It loads as any other Windows app so when you close it, it's gone.   No footprint beyond the disk space it uses.  Plus, unlike a VM it docks a bar on your current desktop.  It's like having the VM act as an extension to your Windows environment.  Very cool.  You can access your local hard drive as /mnt/C so you can have all the Linux tools at your finger tips (grep, chron, sed, vi, etc...)  I've only used this for a day or two but it seems like it's going to be very helpful.  Oh yeah the root password is 123456.

Happy Ubuntuing!

Friday, April 03, 2009

Safe and Reliable DNS

If you haven't heard about OpenDNS and ScrubIT, you should really to take a look at them.  Both services are DNS servers on the Internet that will help protect you computer from connecting to known compromised hosts.new_logo1   In addition to that, you can set up the servers to block access to adult sites and run some basic content control.  I've been using ScrubIT at home on my kids computers for over a year now and it's been working great.  I'm wondering if it is still going to be available because the homepage is nothing more then a logo these days. OpenDNS on the other hand lets you have much greater control over content.  By setting up a free account you can list your IP addresses or even your dynamic DNS name and set a profile of settings to control what is and isn't available.  We switched over at work to OpenDNS to protect against viruses like conficker and since we did we've noticed that their DNS servers seem to respond quicker then the ones provided by our ISP.  The bonus is you even get some performance metrics showing your DNS use.

Happy surfing!!!

Wednesday, April 01, 2009

phpLogCon on Orange JeOS

Now that we have rsyslog working on Orange JeOS it sure would be nice to get phpLogCon working so that we could see the logs via a web browser.  Because my application of rsyslog is firewall specific, it deals with a ton of traffic.  So much traffic in fact, that I don’t wanna mess with MySql back end.  MySql tends to slow things down too much.  So, I set up rsyslog to store it’s data to /var/log/syslog and I’m going to set up phpLogCon to pick it up from there. Here’s the play by play:

  • yum install httpd php php-gd
  • edit /etc/httpd/conf/httpd.conf and set the “Servername” variable to the name or IP of your machine.
  • service httpd start
  • chkconfig httpd on
  • Allow httpd (port 80)  in iptables with  ”iptables -I RH-Firewall-1-INPUT 3 -p tcp -m tcp --dport 80 --tcp-flags SYN,RST,ACK SYN -j ACCEPT” 
  • wget http://www.phplogcon.org/Downloads-req-getit-lid-54.phtml
  • cd ~
  • tar –zxvf phplogcon-2.6.2.tar.gz
  • cd phplogcon-2.6.2
  • mkdir /var/www/html/syslog
  • cp –a src/* /var/www/html/syslog
  • cp contrib/configure.sh /var/www/html/syslog
  • cd /var/www/html/syslog
  • chmod 777 configure.sh
  • ./configure.sh (This will create a file called config.php)
  • rm configure.sh
  • chmod 666 config.php
  • chcon –Rv –type=httpd_sys_content_t /var/www/html/syslog (Note: This changes the selinux config to allow the syslog folder to work with the httpd daemon.)
  • chcon –Rv –type=httpd_sys_content_t /var/log/syslog
  • chmod 644 /var/log/syslog
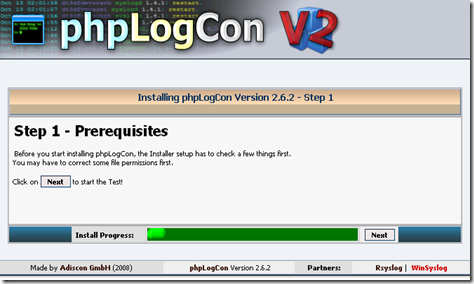
  • Browse (on another computer) to http://yourservername/syslog . You should see this screen:

image

Click the word “here” above to begin the configuration.

image

Now click the Next button.

image

Again, click the Next button

image

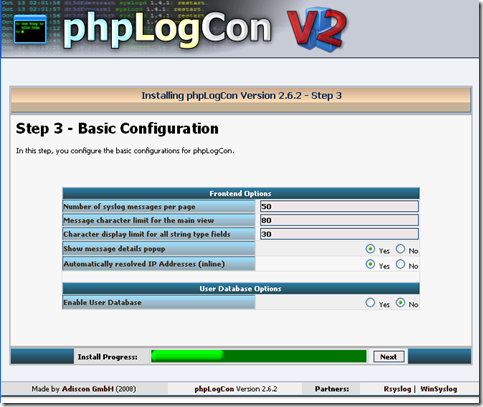
I took the defaults above to get started. Click the Next button.

image

The defaults were fine again.  Click Next

image

  1. Finish up with a “chmod 644 config.php”

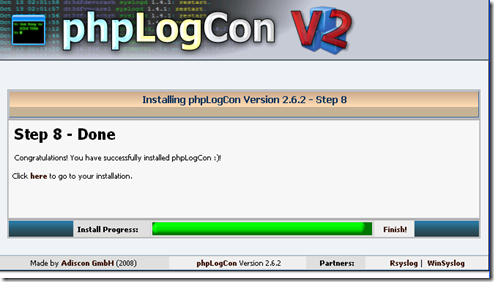
We’re done.  Now click the word “here” in the above screen and you should see you syslog data.

Good luck and happy logging!